Market Trends: Understanding the Numbers
Real Estate Market Analysis: The Devil’s in the Details
Now, let’s get down to brass tacks. The real estate market in 91436 is, in a word, competitive. But not in the way you might think. It’s not just about who can throw the most money at a property (although that certainly doesn’t hurt). It’s about who can navigate the nuances of this unique market.
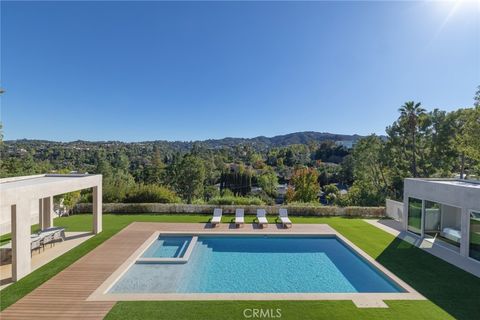
Here’s the tea: homes in 91436 are selling for about 2% below list price on average. But don’t let that fool you into thinking it’s a buyer’s market across the board. The really hot properties – you know, the ones with the killer views and the Instagram-worthy pools – those can still command prices 1% above list.
And here’s where it gets really interesting. The inventory of homes varies wildly depending on what you’re looking for. The number of 3-bedroom homes increased by 4.7% compared to the previous month, while 4-bedroom homes decreased by 11.9%. It’s like playing real estate Tetris, trying to fit your dream home into the ever-shifting landscape of available properties.
Let’s break down some key market statistics:
- Median Home Price: $2.1 million (as of November 2024)
- Price per Square Foot: $748 (11.6% increase from last year)
- Homes Sold Below Asking Price: 70%
- Homes Sold Above Asking Price: 24%
- Average Days on Market: 46 days
These numbers paint a picture of a market that’s still hot, but not scorching. It’s a market where opportunities exist for savvy buyers who know where to look.
Days on Market: Timing is Everything
Time is money, honey, and in 91436, homes are taking their sweet time to sell. On average, properties are spending about 46 days on the market before someone snatches them up. That’s an 86.9% increase compared to last year.
But here’s where it gets juicy. While some homes are languishing on the market, others are flying off the shelves faster than the latest iPhone. About 46% of homes sold within 30 days, while 41% took between 30 to 90 days to find a buyer. And for those unicorn properties that seem to defy all market logic? They’re taking over 90 days to sell.
What does this mean for you, intrepid home seeker? It means opportunity. It means that with the right strategy and a keen eye, you could snag your dream home before someone else realizes what a gem it is. Or, if you’re feeling particularly adventurous, you could set your sights on one of those 90+ day properties and see if there’s room for negotiation.
Here’s a breakdown of the days on market:
- 0-30 days: 46% of homes
- 30-90 days: 41% of homes
- 90+ days: 13% of homes
This spread suggests that while there’s still strong demand for desirable properties, buyers are becoming more discerning. They’re willing to wait for the right home at the right price, rather than jumping at the first available property.
Price Trends: The Ups and Downs
Let’s dive deeper into the price trends in 91436. While the overall median price has seen a slight dip, the price per square foot has increased. This suggests a shift in buyer preferences towards quality over quantity.
Here’s a breakdown of home prices by bedroom count:
- 1 bedroom: $350,000 (up 18.6% from last year)
- 2 bedrooms: $630,000 (down 1.6% from last year)
- 3 bedrooms: $1.3 million (up 5.2% from last year)
- 4 bedrooms: $2.1 million (up 1.7% from last year)
- 5+ bedrooms: $3.4 million (down 1.9% from last year)
These numbers reveal some interesting trends. The significant jump in 1-bedroom prices could indicate increased demand for starter homes or investment properties. The slight dip in 5+ bedroom homes might suggest a cooling at the very top of the market.
The 91436 Real Estate Market: A Closer Look
Picture this: You’re cruising down Ventura Boulevard, the sun kissing your skin through the sunroof of your car. To your right, the Santa Monica Mountains loom large, a constant reminder of the natural beauty that surrounds you. To your left, rows of palm trees stand sentinel, guarding the entrances to some of the most luxurious homes you’ve ever laid eyes on. This, my friend, is 91436 – Encino’s crown jewel.
Let’s cut to the chase. The median sale price of a home in this zip code was a cool $2.1 million in November 2024. Now, before you choke on your kombucha, remember that this is a 2.3% decrease from the previous year. In the world of Los Angeles real estate, that’s practically a fire sale.
But here’s where it gets interesting. Homes in 91436 are selling for about $748 per square foot. That’s an 11.6% increase since last year. What does this mean for you? It means that while overall prices might be dipping their toes in the pool of affordability, the value per square foot is skyrocketing faster than a SpaceX rocket.
Now, let’s talk turkey. In November 2024, 37 homes were sold or pending in Encino. Of these, 70% were sold below asking price. You heard that right – below asking price. In a market where overbidding has become as common as avocado toast, this is music to a buyer’s ears. But don’t get too comfortable. 24% of homes still sold above asking price, proving that the right property can still spark a bidding war worthy of a reality TV show.
Market Dynamics and Trends: Navigating the Encino Real Estate Landscape
The real estate market in 91436 is a complex ecosystem, influenced by a myriad of factors. According to Zillow, the market temperature in this area is described as somewhat competitive. This means you’re not walking into a feeding frenzy, but you’re also not going to be the only fish in the sea.
Here’s a breakdown of some key market trends:
Days on Market: Homes in 91436 are taking an average of 46 days to sell. This is a significant 86.9% increase compared to the same period last year. What does this mean for you? It means you have a bit more time to mull over your decisions, but don’t dawdle too long – the right home can still move quickly.
Price Trends: While the median sale price has dipped slightly, the price per square foot has increased. This suggests that buyers are getting more selective, focusing on quality over quantity. It’s not just about the size of the home anymore; it’s about the value it offers.
Inventory Levels: The number of homes available varies by type. For example, the inventory of 3-bedroom homes increased by 4.7%, while 4-bedroom homes decreased by 11.9% compared to the previous month. This flux in inventory levels can create both challenges and opportunities for buyers.